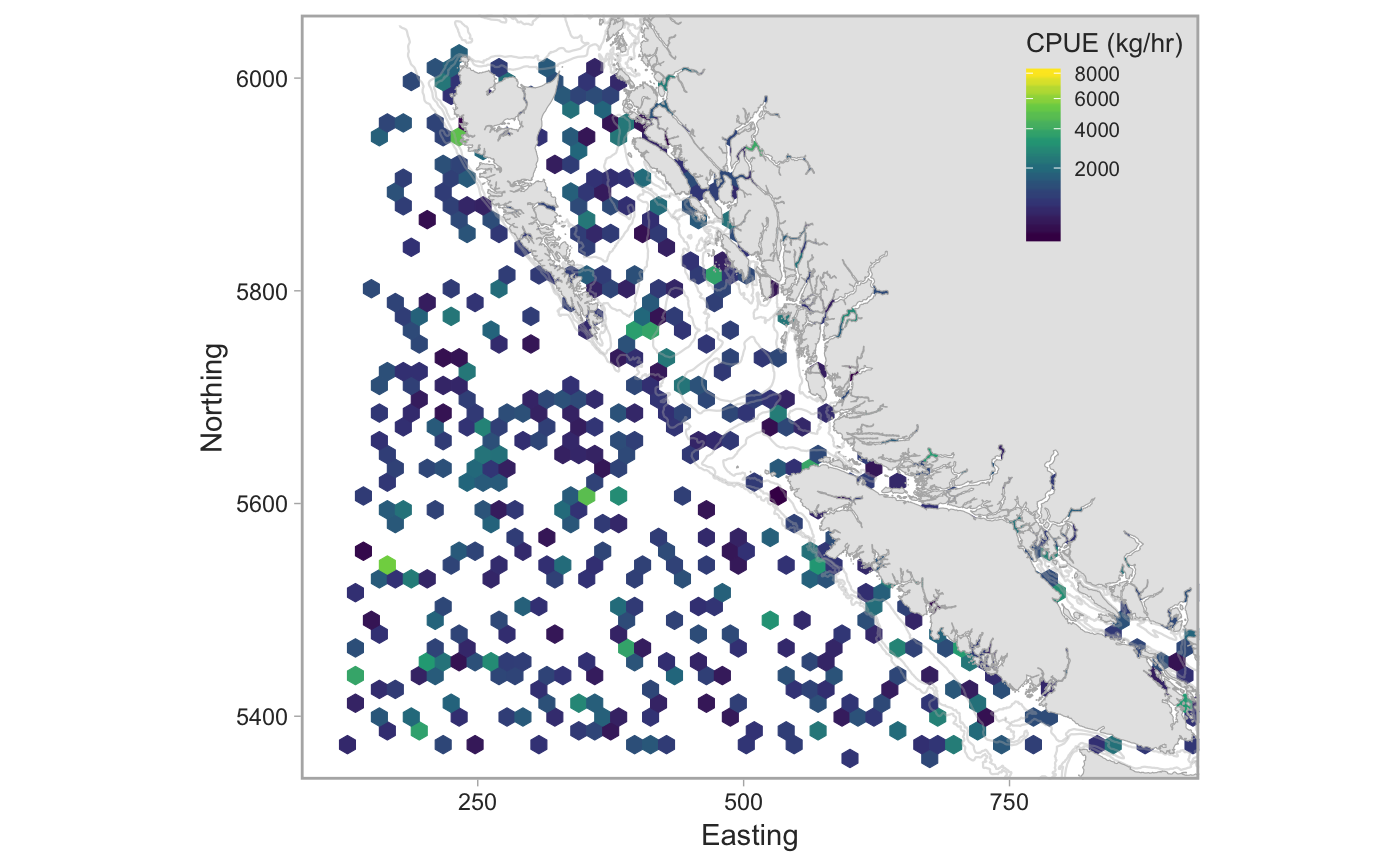
Plot a map of commercial CPUE
plot_cpue_spatial(dat, start_year = 2013, bin_width = 7,
  n_minimum_vessels = 3, xlim = c(122, 890), ylim = c(5373, 6027),
  utm_zone = 9, bath = c(100, 200, 500),
  fill_scale = ggplot2::scale_fill_viridis_c(trans = "sqrt", option =
  "D"), colour_scale = ggplot2::scale_colour_viridis_c(trans = "sqrt",
  option = "D"), rotation_angle = 0, rotation_center = c(500, 5700),
  fill_lab = "CPUE (kg/hr)", show_historical = FALSE,
  return_data = FALSE, min_cells = 1, percent_excluded_xy = NULL,
  percent_excluded_text = "Fishing events excluded due to Privacy Act")
Arguments
| dat | Data from |
|---|---|
| start_year | Starting year. |
| bin_width | Width of hexagons in km. |
| n_minimum_vessels | Minimum number of unique vessels before a hexagon is shown. Defaults to 3 to satisfy privacy requirements. |
| xlim | X axis limits in UTM units. |
| ylim | Y axis limits in UTM units. |
| utm_zone | UTM zone. |
| bath | A numeric vector of depths to show bathymetry countours at. |
| fill_scale | A ggplot |
| colour_scale | A ggplot |
| rotation_angle | Angle to rotate the entire map. Used in the synopsis report to rotate the coast 40 degrees to fit more plots on the page. |
| rotation_center | The center in UTM coordinates around which to rotate the coast if it is rotated at all. |
| fill_lab | Label for the color legend. |
| show_historical | Should the historical extent of fishing (before
|
| return_data | Logical for whether to return the data instead of the plot. |
| min_cells | The minimum number of cells needed before the hexagons are shown. |
| percent_excluded_xy | If not |
| percent_excluded_text | The text to associate with the annotation showing the percentage of fishing events excluded due to the privacy rule. |
Examples
## fake data demo:
xlim <- c(-134.1, -123.0)
ylim <- c(48.4, 54.25)
d <- dplyr::tibble(lat = runif(1000, min(ylim), max(ylim)),
  lon = runif(length(lat), min(xlim), max(xlim)),
  species_common_name = "fake species", fishing_event_id = 1,
  year = 2013, cpue = rlnorm(length(lat), log(1000), 0.6),
  vessel_registration_number = rep(seq_len(100), each = 10))
plot_cpue_spatial(d, bin_width = 15, n_minimum_vessels = 1)