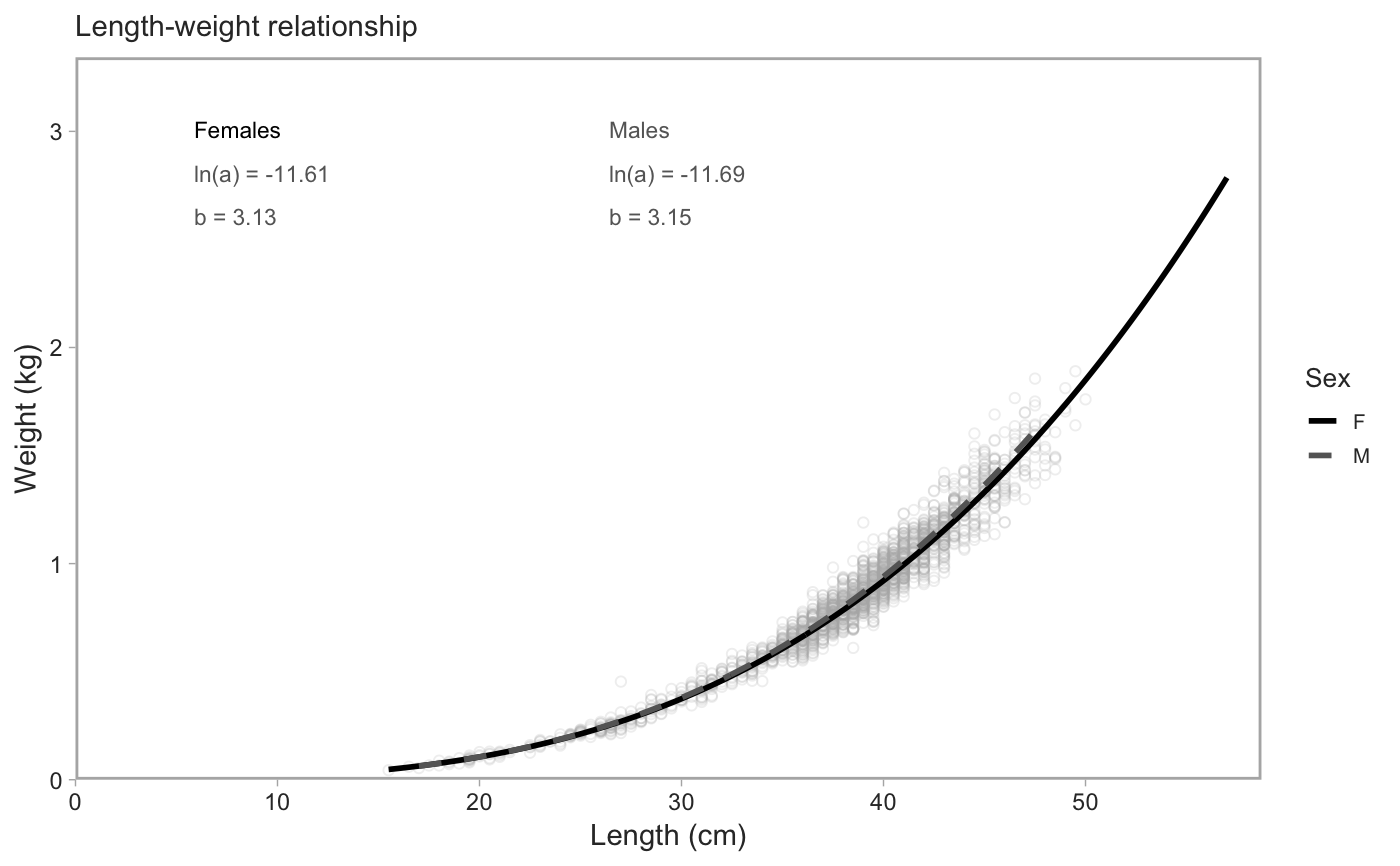
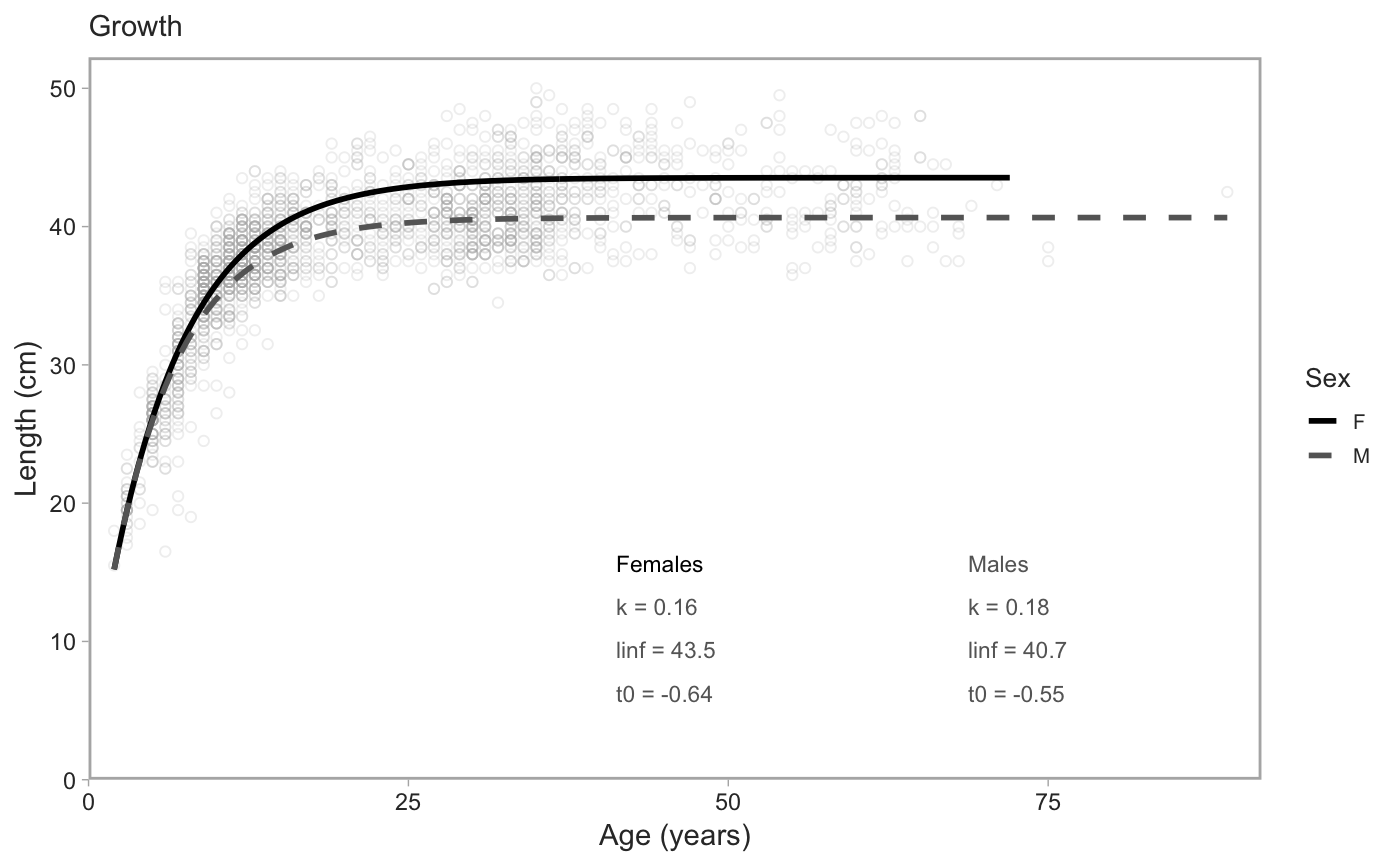
Plot von Bertalanffy or length-weight fits
plot_growth(object_female, object_male, object_all, type = c("vb",
  "length-weight"), downsample = 2000L, pt_alpha = 0.2,
  xlab = "Age (years)", ylab = "Length (cm)", seed = 42,
  lab_x = 0.45, lab_y = 0.3, lab_x_gap = 0.3, lab_y_gap = 0.06,
  col = c(Female = "black", Male = "grey40"))

plot_vb(..., type = "vb")

plot_length_weight(..., type = "length-weight", xlab = "Length (cm)",
  ylab = "Weight (kg)", lab_x = 0.1, lab_y = 0.9, lab_x_gap = 0.35)
Arguments
| object_female | Output from |
|---|---|
| object_male | Output from |
| object_all | Output from |
| type | von Bertalanffy or length-weight fits? |
| downsample | Downsample the individual fish to plot down to this number. |
| pt_alpha | Transparency for the points. |
| xlab | Label for the x axis. |
| ylab | Label for the y axis. |
| seed | A random seed value that only comes into play for downsampling. |
| lab_x | Fraction from left to place text labels. |
| lab_y | Fraction from bottom to place text labels. |
| lab_x_gap | Horizontal gap between text labels. |
| lab_y_gap | The vertical gap between text labels. |
| col | A named character vector declaring the colors for female and male fish. |
| ... | Arguments to pass to |
Details
You can include object_female and/or object_male or object_all
depending on whether the model was fit to female, male, or both sexes
combined.
Examples
# d <- get_survey_samples("pacific ocean perch") d <- pop_samples model_f <- fit_length_weight(d, sex = "female")#> Note: Using Makevars in /Users/seananderson/.R/Makevarsmodel_m <- fit_length_weight(d, sex = "male") plot_length_weight(object_female = model_f, object_male = model_m)#> Warning: NA/NaN function evaluation#> Warning: NA/NaN function evaluationplot_vb(object_female = model_f, object_male = model_m)