Plot maturity frequency by month
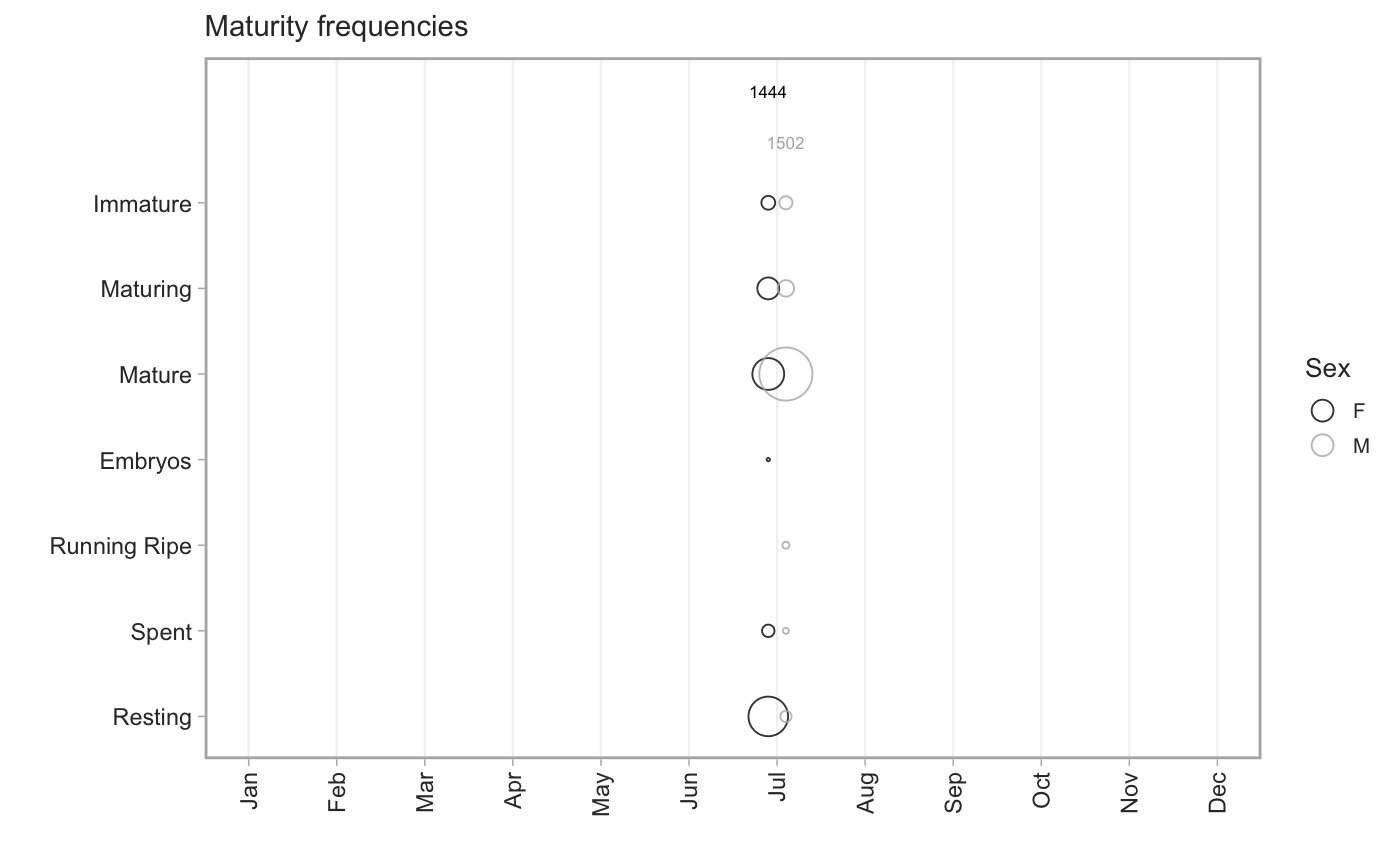
tidy_maturity_months(dat, months = seq(1, 12), usability_codes = c(0,
  1, 2, 6))

plot_maturity_months(dat, max_size = 9, sex_gap = 0.2, fill_col = c(M
  = "grey70", F = "black"), line_col = c(M = "grey70", F = "black"),
  alpha = 0.8, title = "Maturity frequencies", n_label_pos = c(0.7,
  1.3), min_fish = 0)
Arguments
| dat | For |
|---|---|
| months | A vector of months to include. Defaults to all. |
| usability_codes | An optional vector of usability codes.
All usability codes not in this vector will be omitted.
Set to |
| max_size | The maximum size of the circles. |
| sex_gap | A gap to separate the male and female circles. |
| fill_col | The fill color of the circles. |
| line_col | The line color of the circles. |
| alpha | The transparency of the circles. |
| title | A title to add to the plot. |
| n_label_pos | A numeric vector of length 2 that gives the y position of the text describing the number of male and female samples within each month bin. |
| min_fish | The minimum number of fish for the circles to be plotted for a given month. |
Examples
# pop_samples <- get_survey_samples("pacific ocean perch")
tidy_maturity_months(pop_samples) %>%
  plot_maturity_months()# NOT RUN {
d <- get_survey_samples("lingcod")
tidy_maturity_months(d) %>%
  plot_maturity_months()
# }