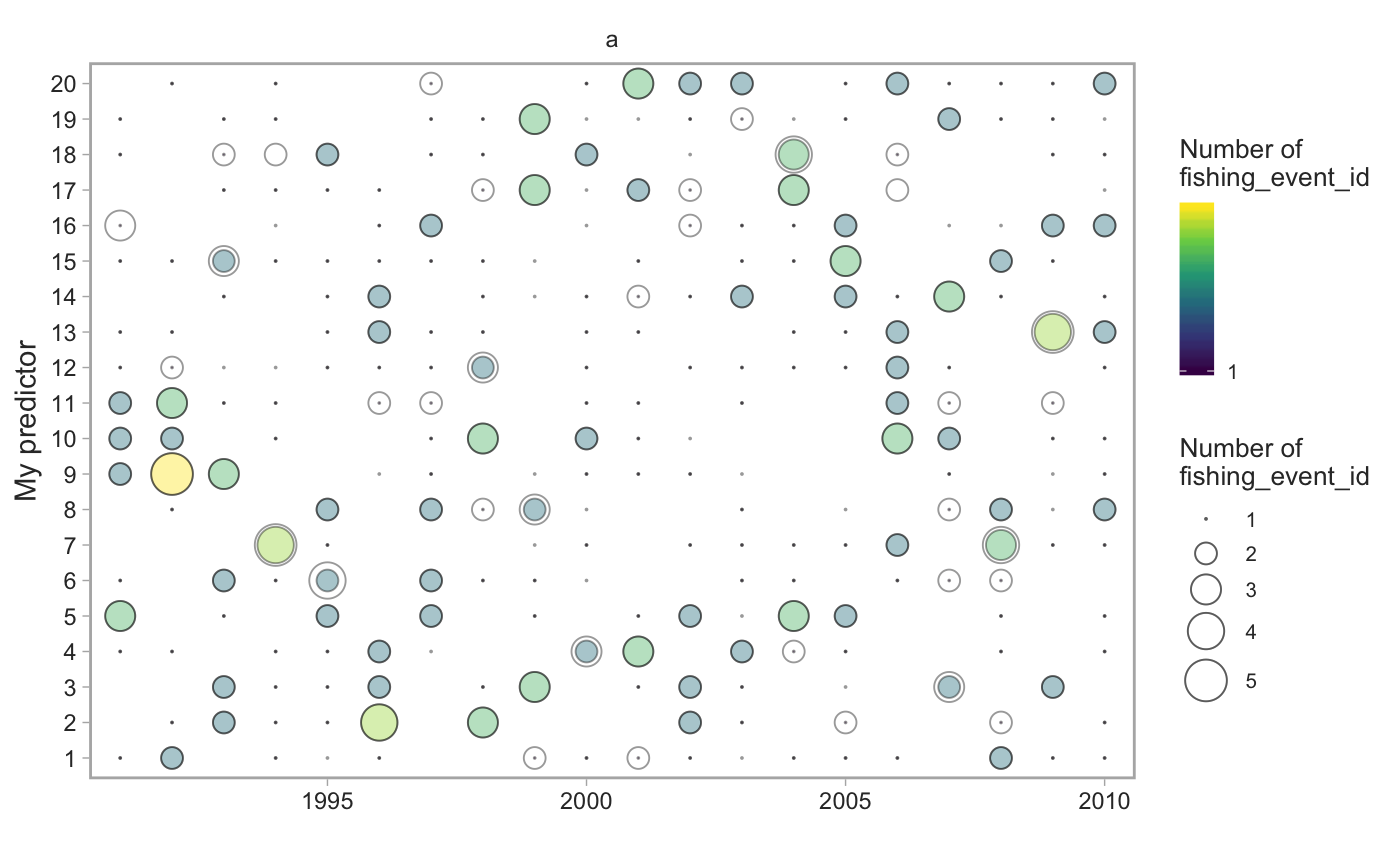
Make predictor level bubble plots
plot_predictor_bubbles(dat, variable, group_id = "fishing_event_id",
  ncol = 2)
Arguments
| dat | A data frame with the columns area, year |
|---|---|
| variable | The column to summarize (character value) |
| group_id | The events to count over (e.g. |
| ncol | Number of facetted columns (facets by area) |
Value
A ggplot object
Examples
d <- data.frame(year = rep(1991:2010, each = 20),
  spp_catch = rbinom(20 * 20, size = 1, prob = 0.8),
  fishing_event_id = rep(1:20, 20),
  my_predictor = sample(gl(20, 20), size = 400),
  area = rep("a", 400))
plot_predictor_bubbles(d, "my_predictor")