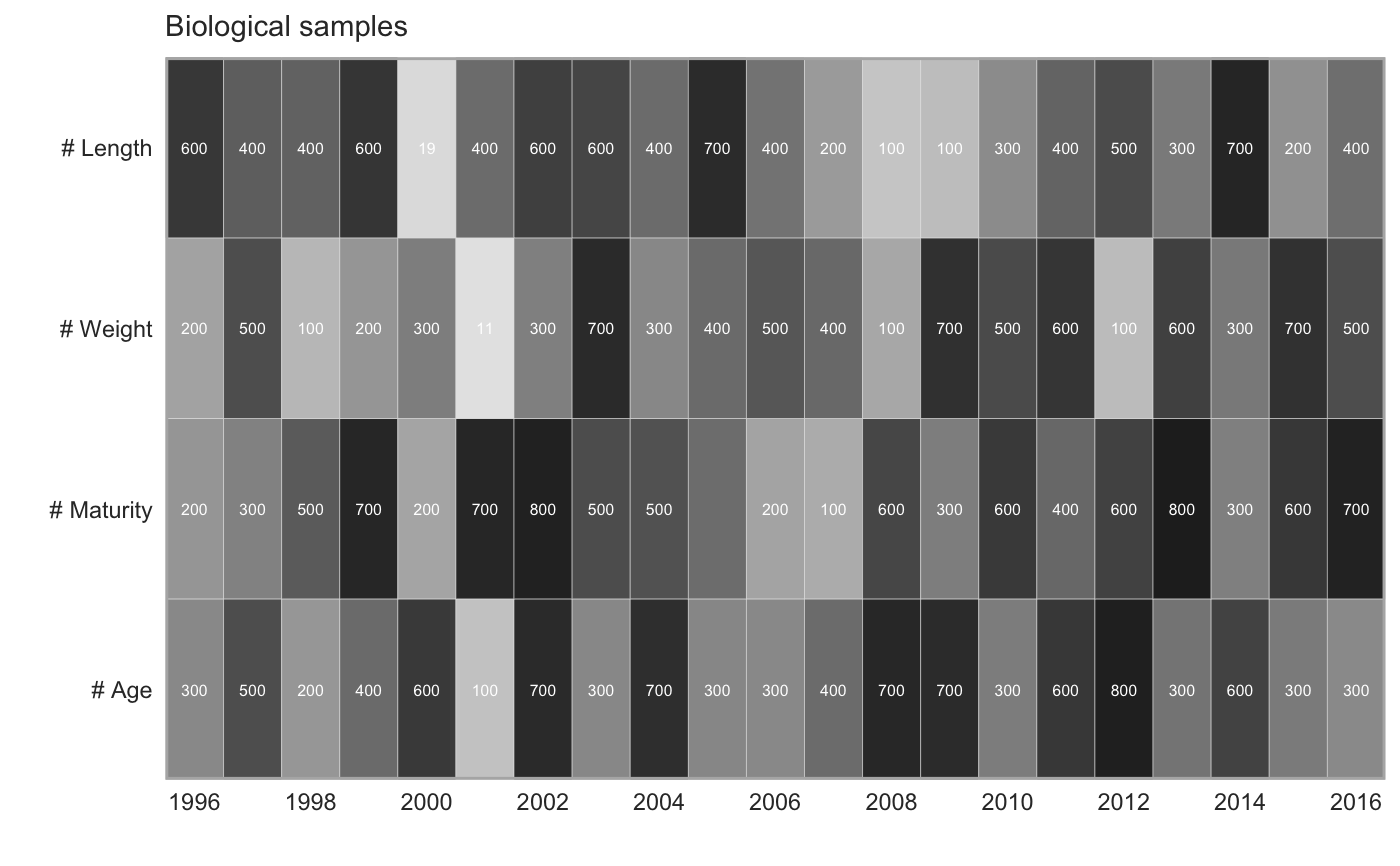
Plot sample availability
plot_sample_avail(dat, year_range = NULL, title = "Biological samples",
  palette = "Greys", trans = sqrt)
Arguments
| dat | An input data frame from, for example,
|
|---|---|
| year_range | An optional year range. |
| title | A title for the plot. |
| palette | A palette to pass to |
| trans | A function to transform the counts before applying the color
scale. E.g. |
Examples
set.seed(1) d <- expand.grid(year = 1996:2016, type = c("maturity", "weight", "length", "age"), stringsAsFactors = FALSE) d$n <- round(runif(nrow(d), 0, 800)) d$n[10] <- 0 # example zero plot_sample_avail(d)# NOT RUN { d <- get_survey_samples("lingcod") d <- tidy_sample_avail(d, year_range = c(1996, 2016)) plot_sample_avail(d, year_range = c(1996, 2016), title = "Survey samples") d <- get_commercial_samples("lingcod") d <- tidy_sample_avail(d, year_range = c(1996, 2016)) plot_sample_avail(d, year_range = c(1996, 2016), title = "Commercial samples") # }